Bee Dash
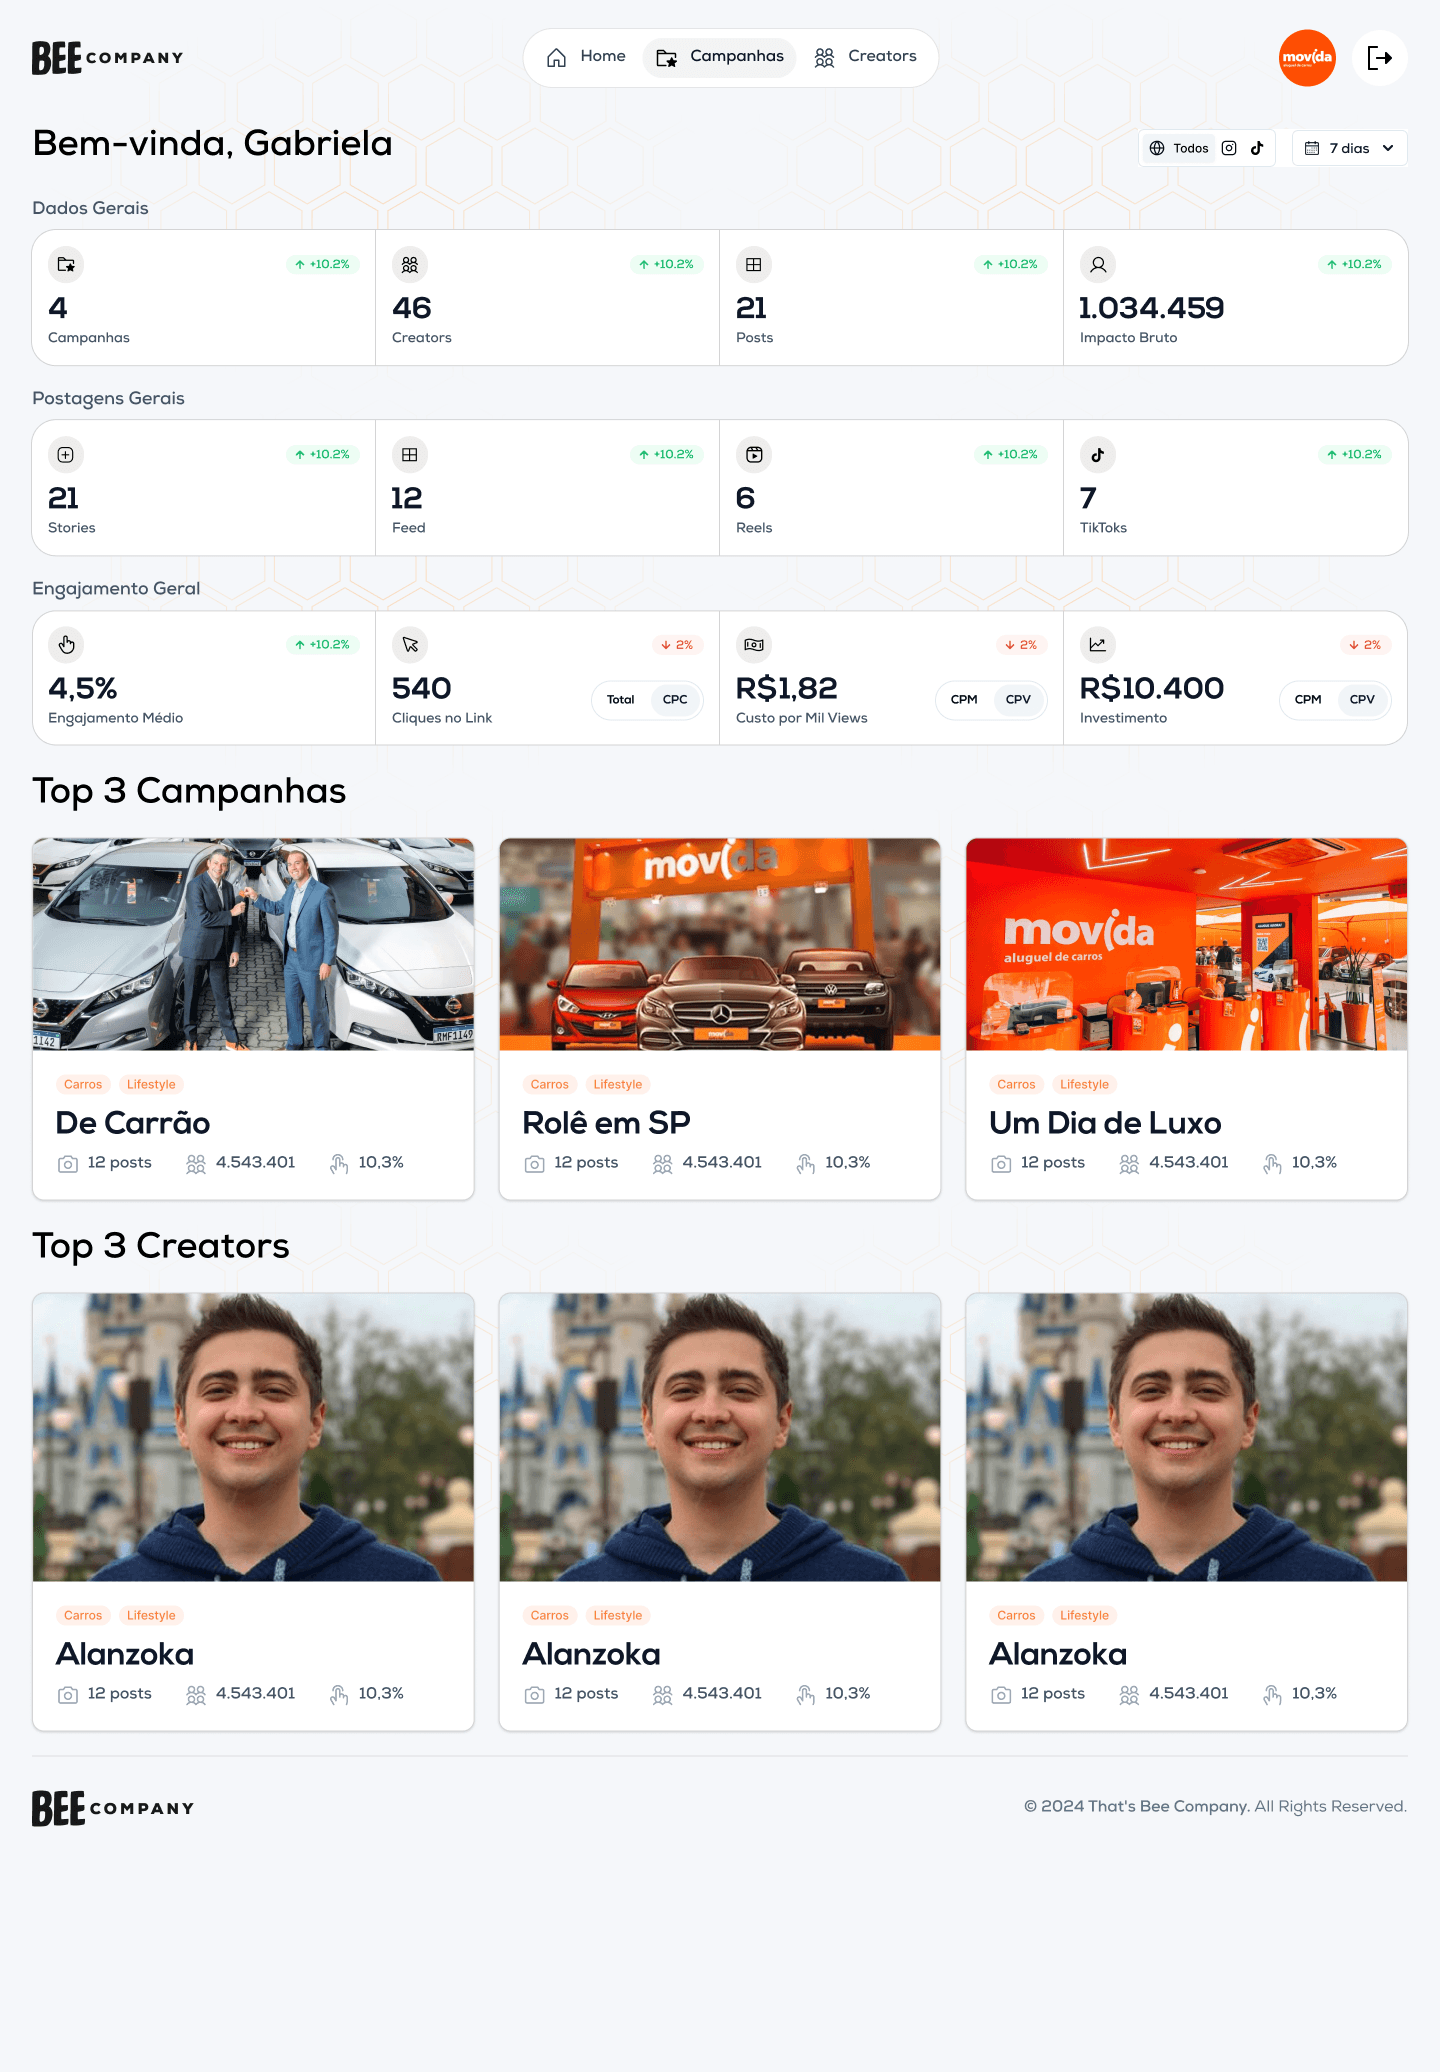
Influencer marketing analytics dashboard
In plain English
A dashboard for marketing teams that pulls numbers from social media accounts automatically and shows whether a campaign is actually working.
My role
Full stack developer
Timeline
Ongoing
Team
Small team
Status
In development
Design
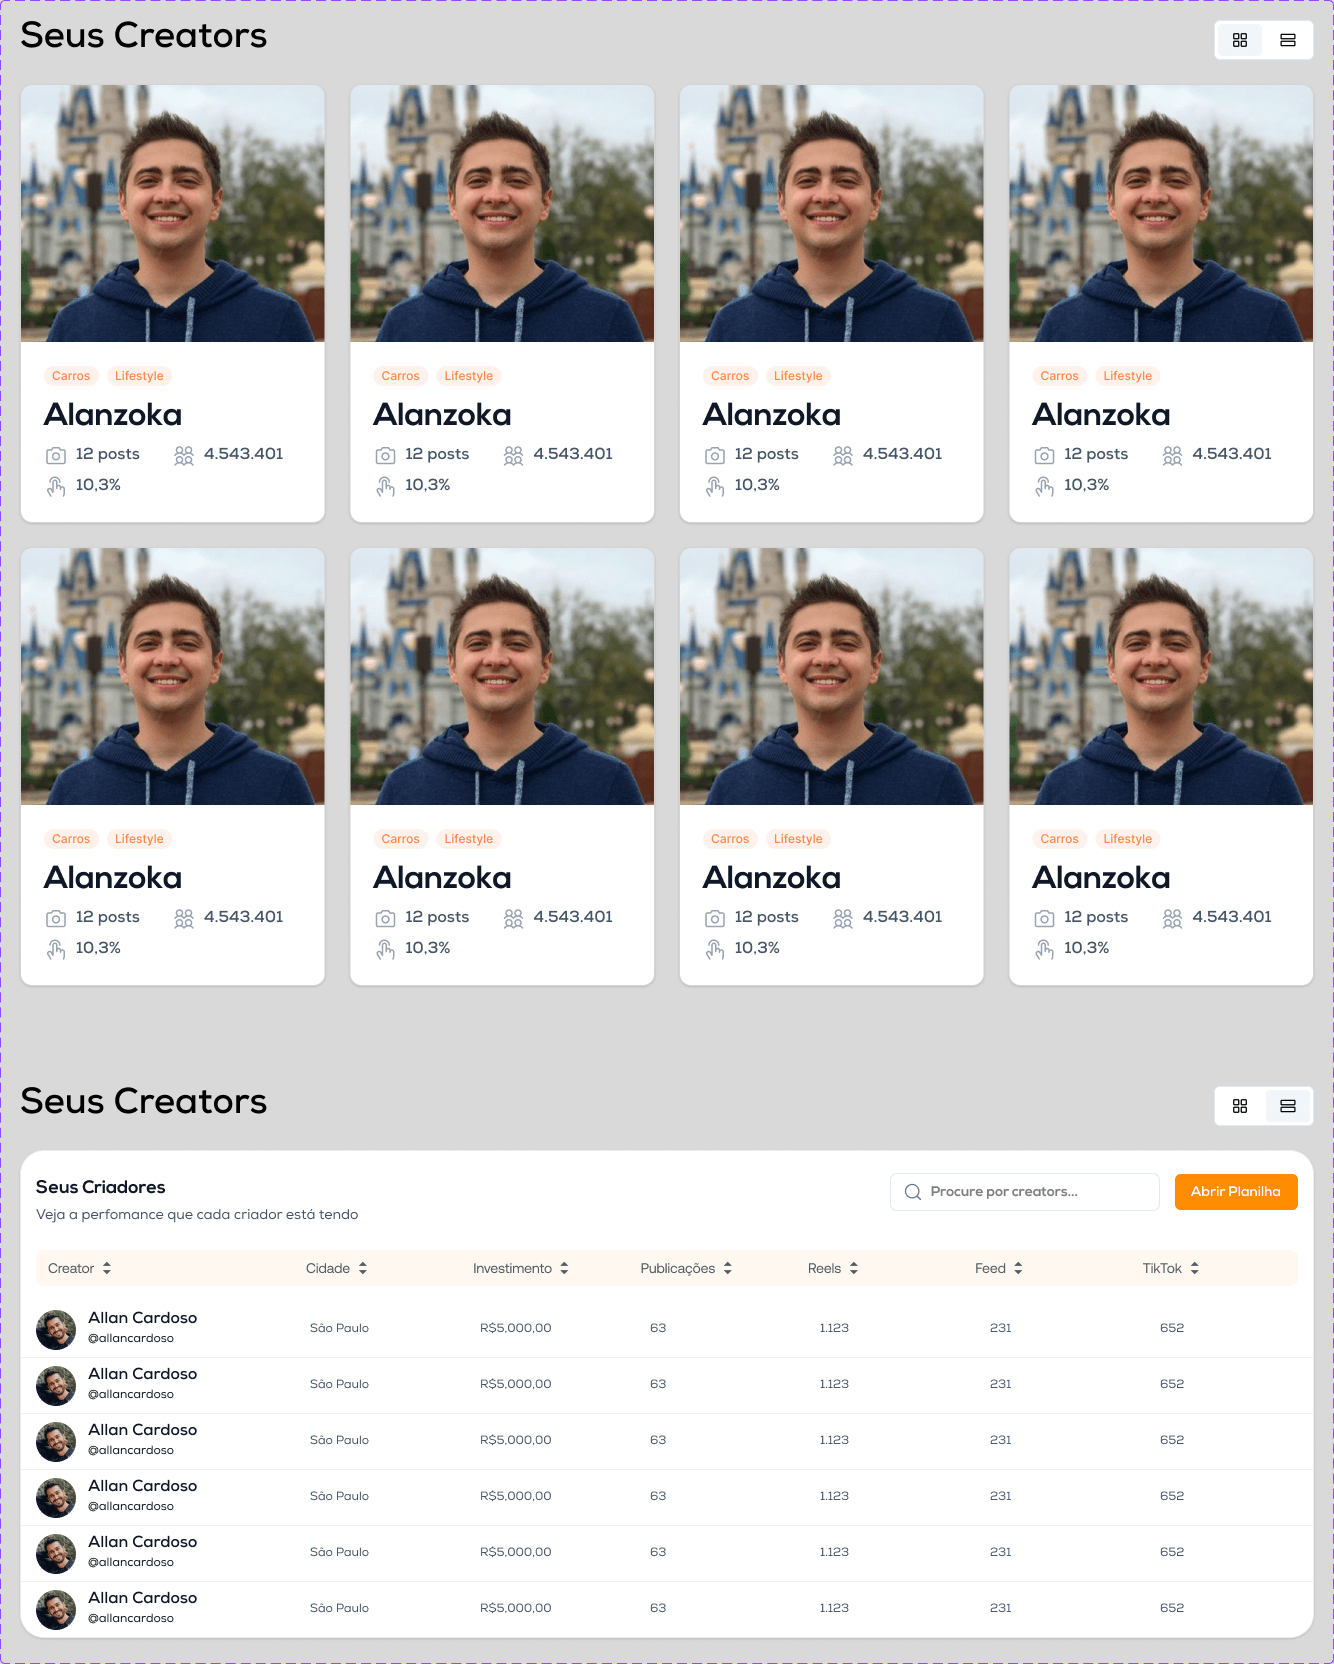
Product tour



Section 01
The problem
Influencer campaign reporting is usually a spreadsheet assembled by hand. Someone opens each creator's analytics, copies reach and engagement into cells, and by the time the report is ready the campaign has moved on. There is no reliable way to compare creators or spot a campaign underperforming while it is still running.
Section 02
How I approached it
Bee Dash ingests social platform metrics through their APIs, normalises them into a single schema regardless of which platform they came from, and renders comparable visualisations. The system is a monorepo with three deployables — a NestJS API, the client-facing Next.js dashboard, and an internal admin panel — sharing one set of types.
Outcome
Campaign performance visible in near real time, with creators comparable on the same axes instead of platform-specific vanity metrics.
Section 03
Going deeper
Normalising incompatible platforms
Every social platform defines engagement differently and exposes different fields at different granularities. The core design work was a canonical metrics schema that each platform adapter maps into. Once data is normalised, every chart, comparison, and export downstream works identically regardless of source.
Why a monorepo
Three applications share the same domain model. In separate repositories, a change to a metric definition means coordinated releases and inevitable drift. With pnpm workspaces, shared types live in one package, and a breaking change fails the build immediately in every consumer rather than silently in production.
Dashboards that answer questions
The visualisations are built around specific decisions: is this creator worth renewing, is this campaign pacing correctly, which content format performs best. Charts exist to answer those, not to fill space.
Section 04
The build process
Define the canonical metrics
Agreeing what 'engagement' means across platforms before writing a single adapter.
Build the ingestion layer
Per-platform adapters handling auth, rate limits, and pagination, all producing the same normalised output.
Ship the shared UI system
shadcn/ui as the base so the client dashboard and internal admin stay visually and behaviourally consistent.
Split the workspaces
API, dashboard, and admin as separate apps with shared packages for types, config, and UI primitives.
Section 05
How the pieces fit together
Each layer has one job. Read it top to bottom — that's roughly the path a request takes through the system.
Next.js dashboard
Campaign views, creator comparison, and interactive data visualisations.
Admin panel
Operational tooling for managing accounts, campaigns, and data sources.
NestJS service
Modular backend with dependency injection, handling ingestion, aggregation, and access control.
PostgreSQL + Prisma
Normalised metric storage with typed queries and versioned migrations.
pnpm workspaces
Shared types and UI packages consumed by every app in the monorepo.
Section 06
What it does
Multi-platform ingestion
Social APIs pulled on a schedule and normalised into one schema.
Creator comparison
Compare performance across creators on genuinely equivalent metrics.
Interactive visualisations
Filterable, drillable charts rather than static report images.
Separate admin surface
Operational tooling kept away from the client-facing product.
Section 07
The hard parts
Rate limits
Social APIs throttle aggressively. Ingestion is scheduled, batched, and backs off rather than retrying blindly.
Schema drift
Platforms change their APIs without much warning. Adapters isolate that churn so only one file changes when a platform does.
Historical data
Metrics are time series, and the schema had to support trend queries without degrading as volume grows.
Section 08
What I took away
- Normalisation at ingestion beats special-casing at every read site.
- Monorepos are about shared contracts far more than shared tooling.
- A chart that doesn't answer a stated question should be deleted.
Structure
pnpm monorepo
Apps
API + dashboard + admin
Data
Social media APIs
UI
shadcn/ui
Let's build something worth shipping
Available for freelance projects, full-time roles, and technical consulting. Tell me what you're building and I'll tell you honestly whether I'm the right person for it.
Based in Rio de Janeiro, Brazil · Working with teams in any timezone · Fluent in English and Portuguese